

Analytics
Analytics shows how the posts published through Dropslate did and how the connected accounts grew: five KPIs, views over time, followers, the top posts, a split by network and the best time to post. The numbers are the networks’ own, read through their APIs on a schedule; posts not published through Dropslate are not counted. Since 1.4.0
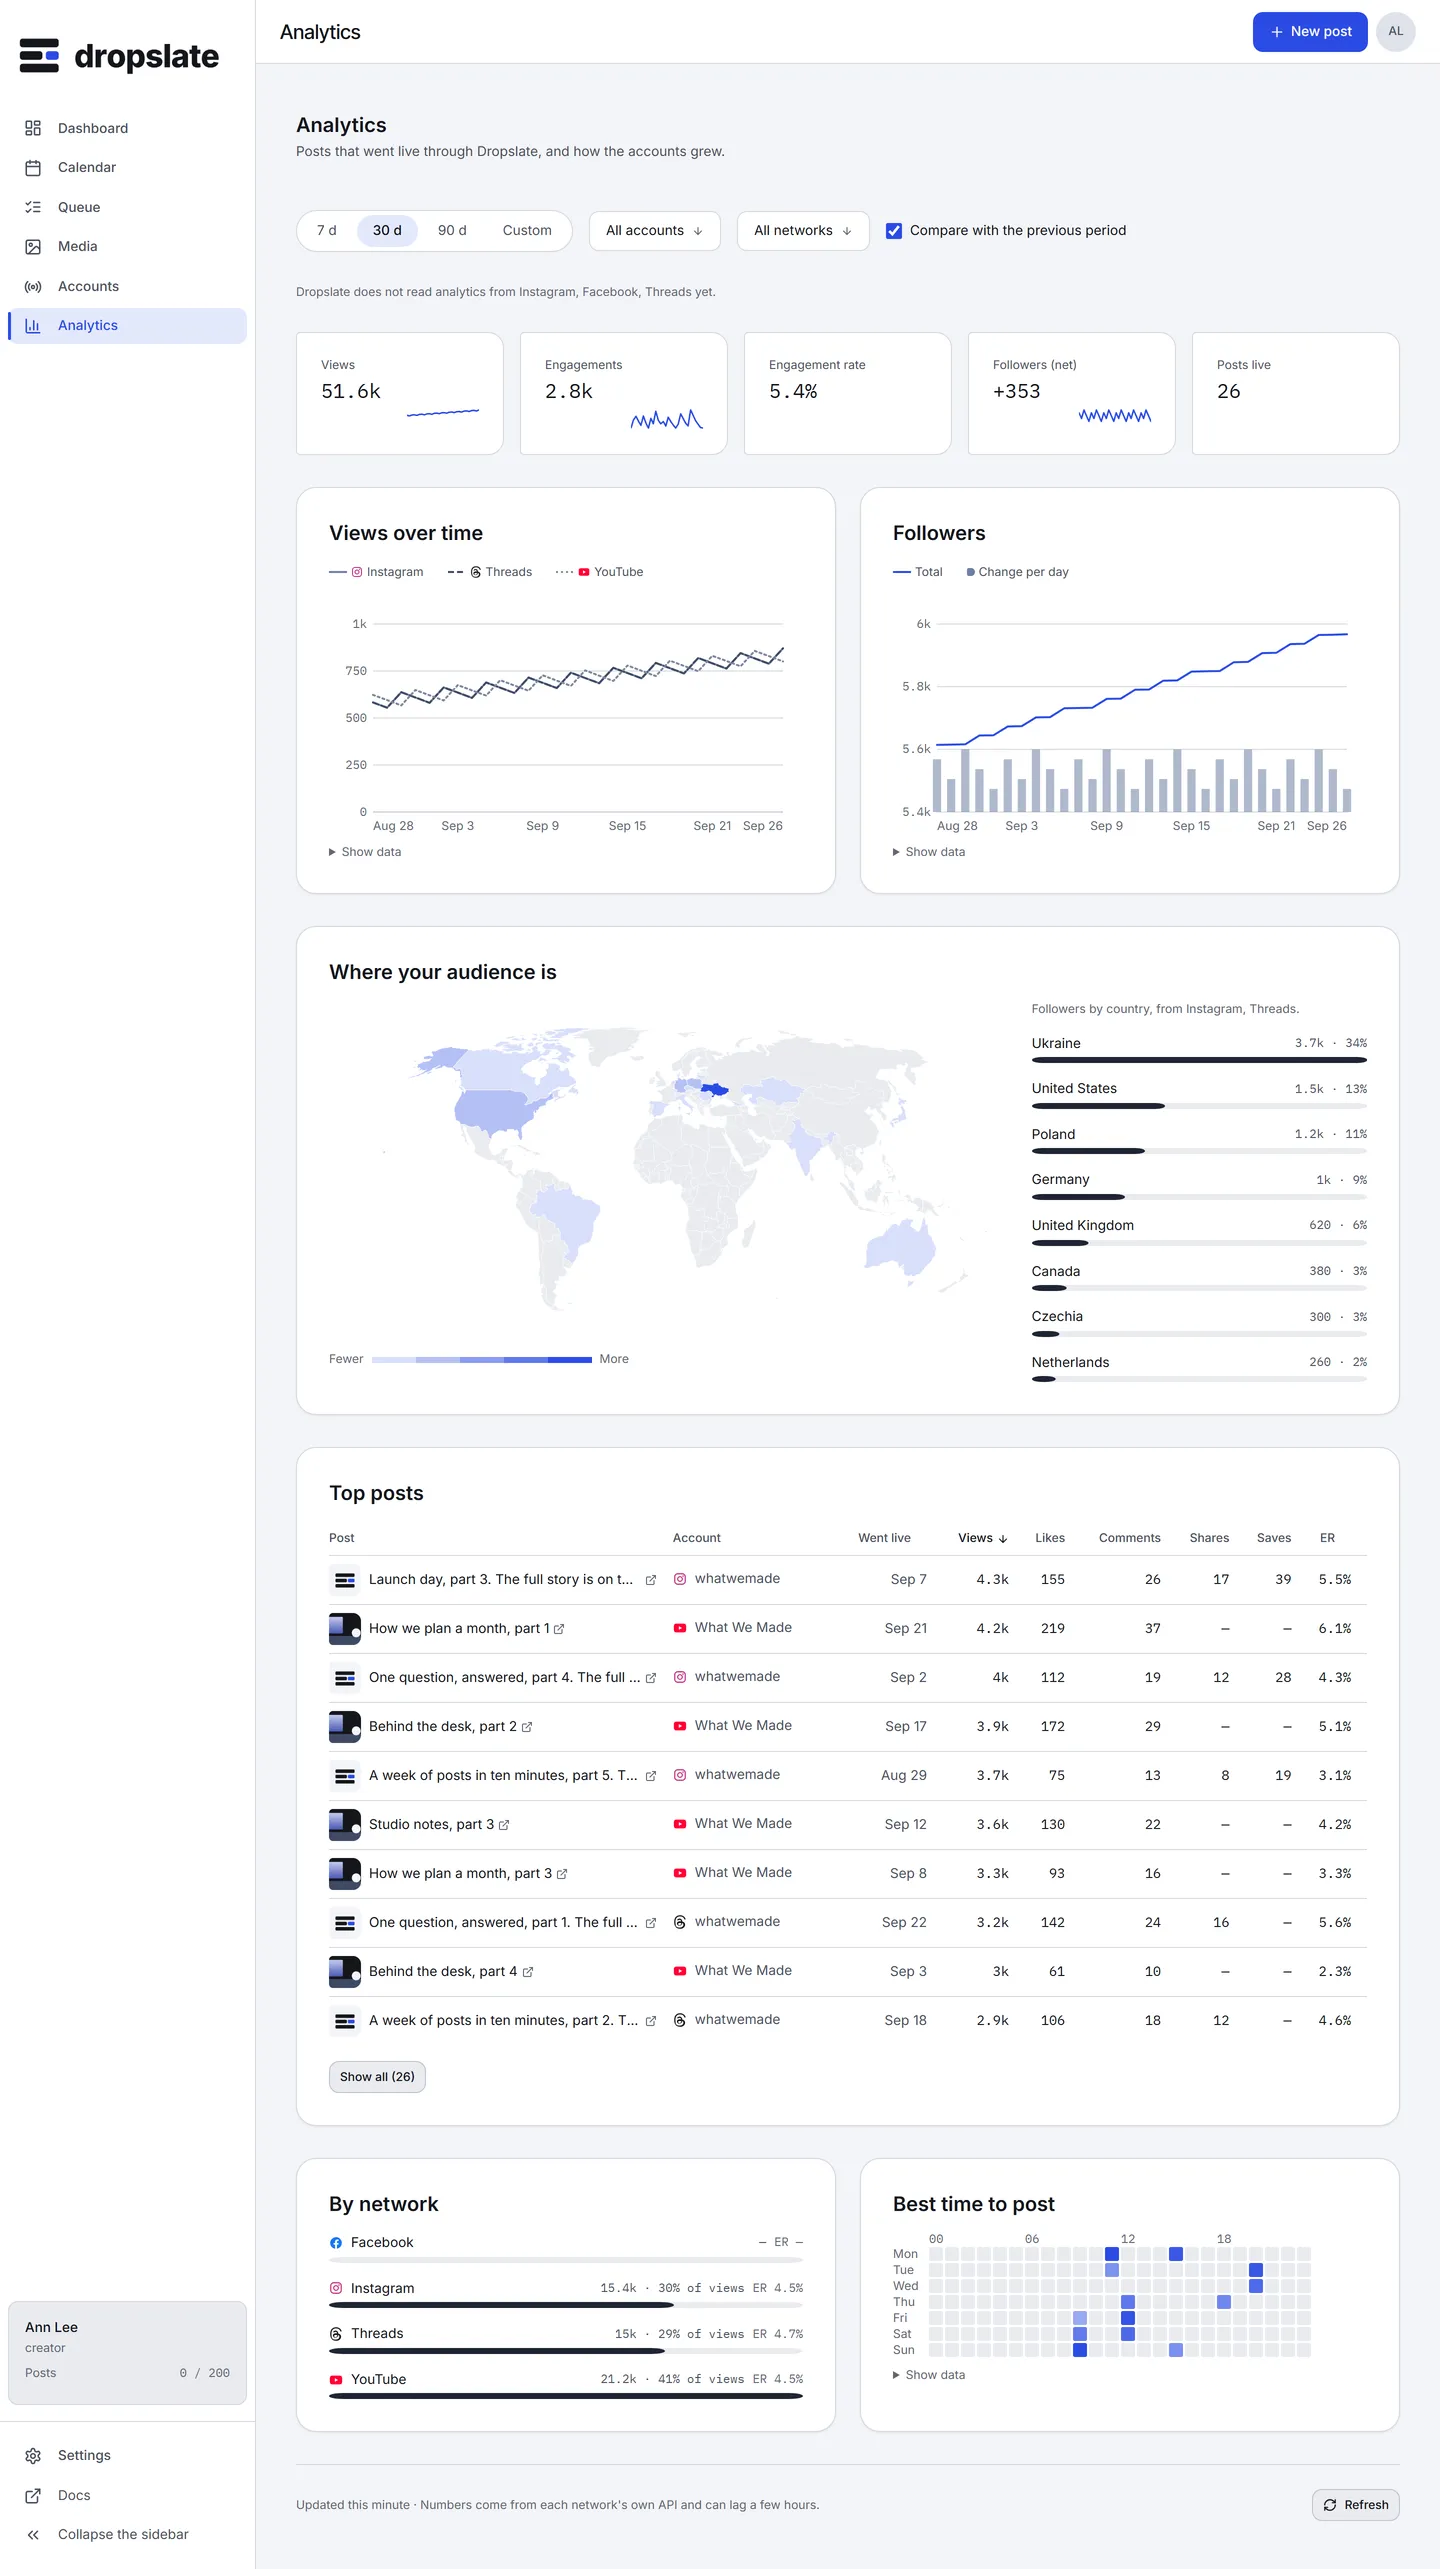
What is on the screen
Section titled “What is on the screen”- Period and filters (top) - 7 d, 30 d, 90 d or Custom dates; Accounts and Networks; Compare with the previous period. All of it is in the URL, so a link shares the same view.
- KPI tiles - Views, Engagements (likes, comments, shares, saves together), Engagement rate, Followers (net), Posts live, each with the change against the previous period when compare is on.
- Views over time - a line per network by day; the previous period as a dotted line.
- Followers - the total each day and the change from the day before.
- Top posts - the posts that went live in the period with views, likes, comments, shares, saves and the engagement rate; sortable; Show all past the first ten; Open on the network.
- By network - each network’s share of views and its engagement rate.
- Best time to post - the average engagement rate by weekday and hour, in the workspace’s time zone. Needs 20 posts live in the period; below that it says how many there are.
- Footer - when the numbers were last read, the note that networks report with a delay, and Refresh.
Every chart has Show data, a plain table of the same numbers.
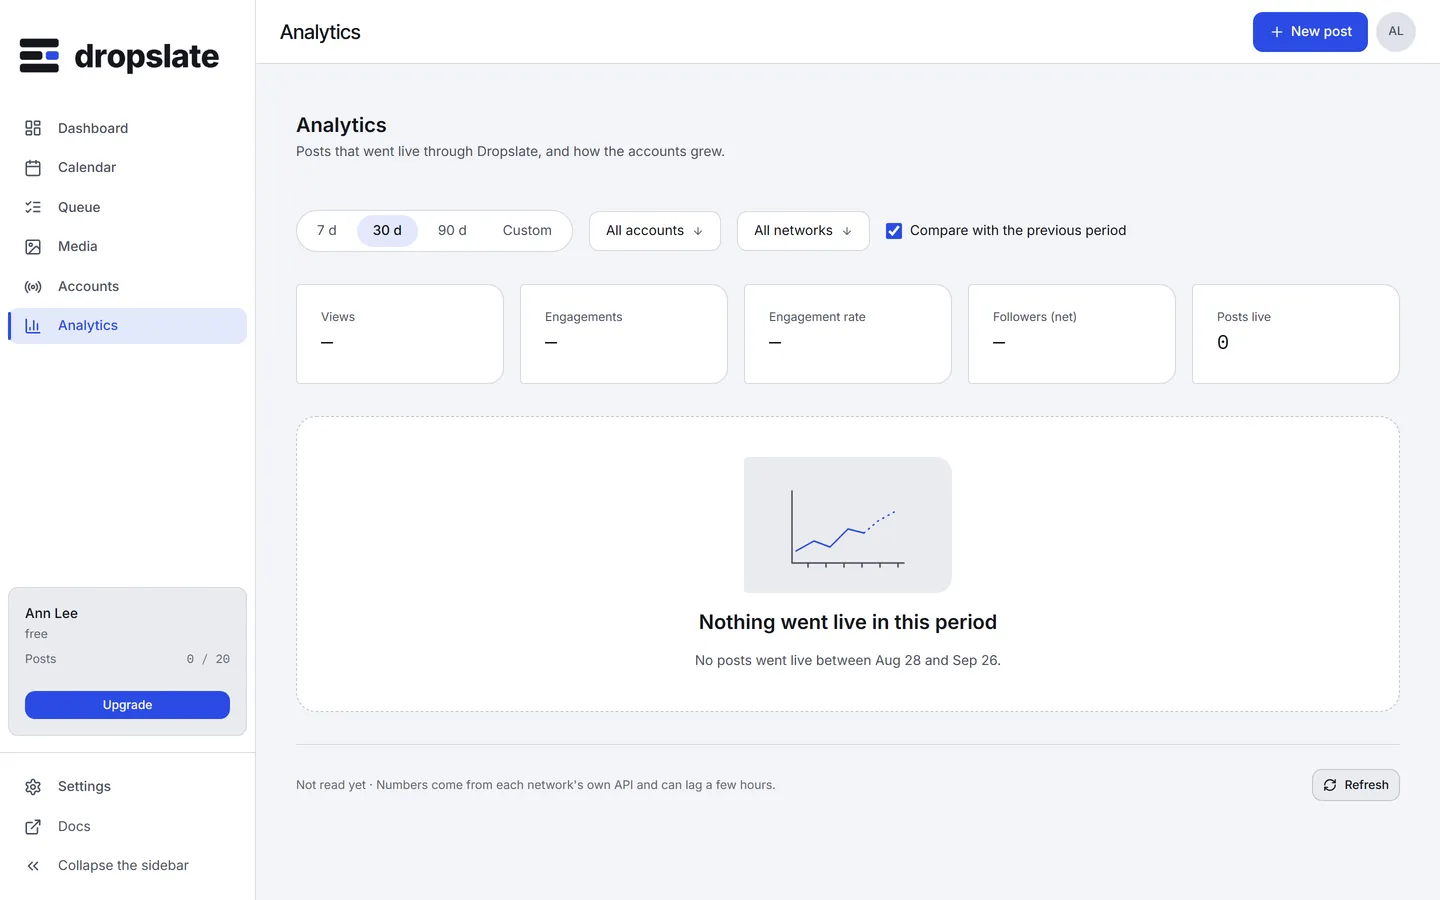
Actions
Section titled “Actions”| Action | Where | What happens |
|---|---|---|
| Change the period or filters | Top | Recomputes the page; the URL changes with it. |
| Refresh | Footer | Reads every account and recent post from the networks now instead of at the next scheduled read. Once per 15 minutes per workspace. |
| Reconnect | The banner on an account | The account was connected before insights were part of the permissions; reconnecting adds them. |
| Open on the network | Top posts | The post itself. |
Why numbers lag
Section titled “Why numbers lag”Dropslate reads statistics on a schedule - a post’s numbers several times a day while it is new, daily after a week, weekly after a month; account followers daily - and each network updates its own counters with a delay of hours. A number the network does not provide is shown as —, never as 0. YouTube reports no shares or saves.
History by plan
Section titled “History by plan”The period can reach back as far as the plan keeps: Free 30 days, Creator 90 Creator+, Studio and Agency 365 Studio+. An earlier start date is moved forward and the page says so.
- The same numbers are available to scripts and agents:
GET /analytics/overview,GET /analytics/postsand the MCP toolsdropslate_analytics_overviewanddropslate_analytics_posts. - Accounts whose network does not share a metric are listed under the charts as unsupported rather than silently counted as zero.
Related
Section titled “Related”- Dashboard - the 30-day tiles come from here.
- API reference → Analytics
- Tools reference